

Our recent visit to Automechanika Frankfurt confirmed something that is already clear: TecDoc is present in many of the aftermarket’s leading companies.
Applications, coverage, competitors, part numbers, vehicle parc, search volumes… Today, there are very powerful tools available to analyse the market and support product range decisions.
But even when combining different advanced analytical methods, some products and market signals still go unnoticed.
There are at least three reasons for this.
1. The limits of application-based analysis
Comparing catalogues through applications is a very powerful way to analyse coverage and identify gaps versus competitors.
But it has two important limitations.
First, its effectiveness depends on having a sufficiently complete and reliable application structure, which is not equally true across all product families, markets or application segments.
Second, identifying a gap versus a competitor does not, by itself, indicate the actual demand for that product or how it should be prioritised against other opportunities.
When the objective is to decide which products to add, identifying the gap is only part of the problem. You also need to understand its demand.
2. The limits of analysing demand at part-number level
Another approach is to analyse search volumes for specific part numbers.
This also provides valuable information.
But the same product may be searched using multiple OE, OEM and IAM part numbers.
For example:
OE A → 2 searches
OE B → 4 searches
OEM C → 3 searches
IAM D → 2 searches
Analysed individually, none of them appears particularly relevant.
But they all represent the same underlying product demand:
Product X → 11 searches
When demand is analysed only at part-number level, a relevant opportunity can become fragmented and lose visibility.
3. The limits of not incorporating your own customer demand
There is another particularly valuable source of information: what your own customers are actually searching for.
Searches on your eCommerce platform, call center enquiries, commercial requests or activity coming from other channels.
This demand directly reflects what your customers are trying to find.
If this information is not incorporated into product range analysis, one of the most direct signals of what the market is demanding is left out of the decision-making process.

A complementary perspective
NEO Radar adds a complementary perspective precisely in these three areas.
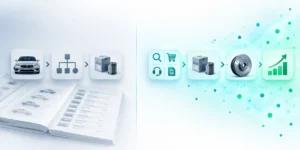
Rather than relying on a single way of analysing the market, it combines different data sources and groups searches in order to interpret demand at product level:
demand (your own + global)→ part numbers → product → opportunity
This makes it possible to detect products that may fall outside application-based analysis, prevent demand from becoming fragmented across different part numbers, and incorporate the real demand of your own customers.
For manufacturers, this adds a new dimension to the analytical tools they already use.
For many distributors and wholesalers, it turns thousands of daily searches into actionable information about their product range.
NEO Radar is not intended to replace TecDoc or existing tools.
It is intended to broaden the field of view.
Because even when strong data sources and analytical methods are already in place, the way signals are grouped and interpreted determines which opportunities we are able to see.
By Joan Cabós
CEO & founder