

Improving a product range in the aftermarket is not just about adding more part numbers.
The real challenge is deciding which products to add, expand or prioritise in a market with millions of references, brands, equivalences, applications and very different demand behaviours.
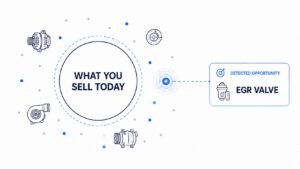
To do this, different tools and sources of analysis can be used. They do not all answer the same question or provide the same value in every case.
Three strategies to improve your product range
Different strategies can be used to improve a product range: analysing the car parc, observing market sales or studying demand. The following table summarises these three approaches together with 10 tools that help apply them.
| Strategy | Question it answers | Tools |
|---|---|---|
| VIO / car parc | Which products should my range cover based on vehicles, applications and vehicles in operation? | S&P Global Mobility / Polk / IHS, Experian VIO, JATO, AutoView, TecDoc PMA, Wrench, Elcome, Wesp |
| Market sales / market share | Which products are being sold in the market, channel or network? | TecCom Market Share |
| Demand / searches | Which products is the market asking for, even though they do not clearly appear in my range or sales? | NEO Radar, TecDoc PMA |
* Most of these tools allow, in one way or another, results to be compared with third-party ranges, competitors, catalogues or suppliers. This comparison helps analyse gaps and support decisions, although detecting a gap does not necessarily mean that the gap is a priority.
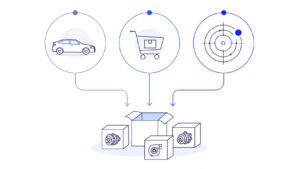
Within the demand / searches strategy, not all solutions analyse information at the same level.
TecDoc PMA incorporates demand signals from TecDoc catalogue usage and queries for OE references. Its analysis is closely linked to the individual OE reference and coverage analysis.
NEO Radar, on the other hand, groups demand signals from web searches, call centres, online catalogues, references not found and unconverted demand at product level. The objective is not only to identify a specific reference, but to discover product range opportunities by grouping equivalent or related references that represent the same market need.
The difference is not only in the source of demand, but also in the level of analysis: individual reference versus product.
Market research and aftermarket consulting: complementary context
In addition to the tools above, there are also market research and aftermarket consulting companies that provide strategic context for improving a product range.
In many cases, these companies do not represent an independent strategy. Instead, they combine different sources of analysis: car parc, sales, catalogue, demand, surveys, sector studies or expert market knowledge.
Some representative companies and sources in this area are:
- GiPA
- Wolk Aftersales
- BBE Automotive
- Hedges Company
- ResearchAndMarkets
- Absolute Reports
- Markanalysis
- Factory Data
When each strategy adds the most value
The most appropriate strategy depends on the type of product, the market and the quality of the available data.
High-rotation or recurring maintenance products
For products such as filters, brakes, clutches, shock absorbers or wiper blades, the car parc, applications and market sales usually provide a lot of information. These are product families where VIO, coverage and market share help significantly in sizing the opportunity.
Assessment: VIO 🟢🟢 · Sales 🟢🟢 · Demand 🟢
Unplanned repair, low-rotation or long-tail products
For sensors, electronics, EGR, turbos, actuators or modules, historical sales do not always explain the full opportunity. If the product is not in the range, it is not sold; and if it is not sold, it may not appear in commercial data. Here, demand signals and searches can provide a particularly useful reading.
Assessment: VIO 🟢 · Sales 🟢 · Demand 🟢🟢
Poorly normalised applications
In industrial, marine, agricultural, machinery or special applications, the parc is usually less structured than in passenger cars. In these cases, demand, customer data, commercial enquiries and sector knowledge gain weight compared with traditional VIO.
Assessment: VIO 🟡 · Sales 🟢 · Demand 🟢🟢
Consumables and commodity products
For oils, lubricants, chemicals, batteries, tyres or universal accessories, VIO can provide significant value in estimating potential consumption, especially when maintenance is linked to car parc, mileage, engine type or regulated service intervals. However, the final product range decision also tends to depend on sales, rotation, brand, price, channel, availability and commercial strategy.
Assessment: VIO 🟢🟢 · Sales 🟢🟢 · Demand 🟡
Body, collision and body parts
For bodywork, lighting, collision or parts that are highly dependent on version, year, side or trim level, the car parc, exact application and catalogue coverage are usually especially important.
Assessment: VIO 🟢🟢 · Sales 🟡 · Demand ⚪
Customers that want to incorporate their own data into the decision process
When the objective is to incorporate the customer’s own data from web searches, call centres, online catalogues, sales history and other internal sources, own sales and captured demand gain weight compared with traditional VIO.
Assessment: VIO ⚪ · Sales 🟢🟢 · Demand 🟢🟢
⚪ Low contribution · 🟡 Medium contribution · 🟢 High contribution · 🟢🟢 Very high contribution
Conclusion
There is no single valid tool for improving a product range.
The car parc / VIO helps estimate potential. Market sales show what is already being captured. Demand can reveal opportunities that do not yet clearly appear in the product range or in sales.
The key is not to choose a single source, but to understand which question each one answers and when it adds the most value.
Improving the product range requires combining car parc, sales and demand according to the type of product, the market and the quality of the available data.
By Joan Cabós
CEO & founder