
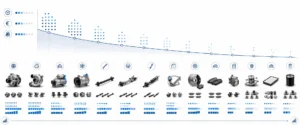
How many products does a product family really need to be well covered in the aftermarket?
The answer does not depend only on the size of demand. It depends on the nature of that family.
There are small families, with a limited product universe, where reaching relevant coverage does not require a very broad range.
There are broad but concentrated families, where many products may exist, although demand is concentrated in a few key products.
And there are broad and fragmented families, where demand is spread across many products and every additional point of coverage requires more investment, more precision and greater selection risk.
That is why coverage should not be analysed only as a final percentage.
It should be understood as a curve: how many products are needed to reach each coverage level and how much it costs to keep moving forward.
The first products are usually the easiest to detect: they concentrate more demand, appear earlier in the analysis and tend to carry a lower risk of poor rotation.
That is one of the major decisions in aftermarket assortment planning.
Not only which products are missing.
But which products are worth adding at each coverage level.
A coverage snapshot by product family
We analysed coverage across different product families, using demand signals from the Spanish market as a reference.
The objective was to estimate how many products would be needed to reach different demand coverage levels, and what approximate initial investment each family would require.
The investment was calculated by applying a different average initial investment per product in each family, based on the estimated average entry cost.
The same analysis can be carried out for other demand scopes, such as Portugal, Iberia, Europe or a specific customer’s demand.
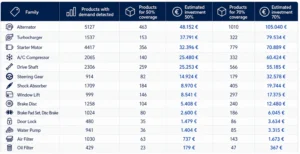
* Products with demand refers to products with demand signals detected within the analysed scope, not to the total universe of existing products in each family.
* Investment is calculated on the basis of a minimum assumption of one unit per product added. It does not represent a real stock policy, but a comparable baseline between families. In high-turnover categories, the investment required to operate the coverage may be higher.
The table shows an important idea: the same level of coverage can require very different levels of effort depending on the product family.
In some categories, initial coverage can be built with few products and a more controlled investment.
In others, the same percentage requires a broader range, more capital and much more precise selection.
The challenge multiplies when a family combines a broad product universe with a high unit cost: every additional point of coverage requires more entry capital and makes it even more important to select the right products to add.
The difficulty starts when coverage expands
The reading changes when coverage is analysed by stages.
In some families, moving from 50% to 70% may require a relatively manageable additional investment.
In others, the same jump requires adding many more products and refining the selection much more carefully.
That is where the risk lies.
Not all assortment expansions have the same efficiency. Some allow coverage to be gained with a reasonable investment. Others add breadth, complexity and stock with a lower probability of rotation.
That is why the decision should not simply be to expand the range.
It should be where to expand, up to what level of coverage and with what expected return.
NEO Radar was created to provide that decision layer: detecting products with real demand, estimating their contribution to the coverage of each family and prioritising where to expand the range with the highest economic potential.
By Joan Cabós
CEO & founder